Do Rainy Months Increase Public Concern About Dengue and Malaria?#
In this notebook, we explore the relationship between total precipitation in India and public awareness of dengue and malaria from 2004 to 2024.
We use varunayan to extract processed precipitation data for India’s region at monthly frequency.
By combining this climate data with Google Trends search activity, we investigate how rainfall patterns relate to public awareness of mosquito-borne diseases — and whether increased precipitation precedes spikes in concern.
Downloading Total Precipitation Data#
We use varunayan.era5ify_geojson to retrieve monthly total precipitation over India using a GeoJSON boundary and the ERA5 dataset.
import varunayan

df = varunayan.era5ify_geojson(
    request_id="prec_india_2004_2024",
    variables=["total_precipitation"],
    start_date="2004-1-1",
    end_date="2024-12-31",
    json_file="https://gist.githubusercontent.com/JaggeryArray/bf296307132e7d6127e28864c7bea5bf/raw/4bce03beea35d61a93007f54e52ba81f575a7feb/india.json",
    frequency="monthly"
)
============================================================
STARTING ERA5 SINGLE LEVEL PROCESSING
============================================================
Request ID: prec_india_2004_2024
Variables: ['total_precipitation']
Date Range: 2004-01-01 to 2024-12-31
Frequency: monthly
Resolution: 0.25°
GeoJSON File: C:\Users\ATHARV~1\AppData\Local\Temp\prec_india_2004_2024_temp_geojson.json


--- GeoJSON Mini Map ---

MINI MAP (68.18°W to 97.40°E, 7.97°S to 35.49°N):
┌─────────────────────────────────────────┐
│·········································│
│········■■■■■■■··························│
│··········■■■■■··························│
│·········■■■■■■■·························│
│·······■■■■■■■■■■························│
│····■■■■■■■■■■■■■■■■········■····■■■■■■■·│
│···■■■■■■■■■■■■■■■■■■■■■■■■■·■■■■■■■■····│
│····■■■■■■■■■■■■■■■■■■■■■■■■·····■■■■····│
│·■■■■■■■■■■■■■■■■■■■■■■■■■■■■···■■■······│
│··■■■■■■■■■■■■■■■■■■■■■■■■■■■············│
│·······■■■■■■■■■■■■■■■■■■■···············│
│·······■■■■■■■■■■■■■■■■··················│
│·······■■■■■■■■■■■■■·····················│
│········■■■■■■■■■························│
│·········■■■■■■■■························│
│··········■■■■■■■························│
│···········■■■■■·························│
│············■■■··························│
│·········································│
└─────────────────────────────────────────┘
 ■ = Inside the shape
 · = Outside the shape
Saving files to output directory: prec_india_2004_2024_output
  Saved final data to: prec_india_2004_2024_output\prec_india_2004_2024_monthly_data.csv
  Saved unique coordinates to: prec_india_2004_2024_output\prec_india_2004_2024_unique_latlongs.csv
  Saved raw data to: prec_india_2004_2024_output\prec_india_2004_2024_raw_data.csv

============================================================
PROCESSING COMPLETE
============================================================

RESULTS SUMMARY:
----------------------------------------
Variables processed: 1
Time period:         2004-01-01 to 2024-12-31
Final output shape:  (252, 3)
Total complete processing time: 94.03 seconds

First 5 rows of aggregated data:
         tp  year  month
0  0.029095  2004      1
1  0.010954  2004      2
2  0.024185  2004      3
3  0.062215  2004      4
4  0.082469  2004      5

============================================================
ERA5 SINGLE LEVEL PROCESSING COMPLETED SUCCESSFULLY
============================================================
Merging Precipitation and Google Trends Data#
Convert precipitation from meters to millimeters
Parse monthly dates
Load Google Trends data for
dengue symptomsandmalaria symptomsMerge the datasets by date for joint analysis
import pandas as pd

df['date'] = pd.to_datetime(df[['year', 'month']].assign(day=1))
df['tp'] = df['tp']*1000
df_dengue = pd.read_csv('https://gist.githubusercontent.com/JaggeryArray/fcc204d10f0b7acdd4813f1581ab18ef/raw/3589dea8be071f545b94f236db1b52f2efd11723/multiTimeline_india_googletrends_dengue_symptoms_2004-now.csv')
df_malaria = pd.read_csv('https://gist.githubusercontent.com/JaggeryArray/5635a5654a0264d71b031fdd073cbf83/raw/8f8c760840507583d1b72a846ed76e3cdbc697ee/multiTimeline_india_googletrends_malaria_symptoms_2004-now.csv')
df_malaria['date'] = pd.to_datetime(df_malaria['Month'], format='%Y-%m')
df_dengue['date'] = pd.to_datetime(df_dengue['Month'], format='%Y-%m')

df_dengue_merged = pd.merge(df, df_dengue, on='date', how='inner')
df_malaria_merged = pd.merge(df, df_malaria, on='date', how='inner')
def setup_matplotlib():
    try:
        import matplotlib.pyplot as plt
    except ImportError:
        raise ImportError(
            "Matplotlib is not installed. Install it with: pip install matplotlib"
        )

    plt.rcParams["figure.dpi"] = 300
    plt.rcParams["savefig.dpi"] = 300
    plt.rcParams["font.family"] = "sans-serif"
    plt.rcParams["font.sans-serif"] = ["Arial"]
    plt.rcParams["axes.labelweight"] = "normal"

    plt.rcParams["mathtext.fontset"] = "custom"
    plt.rcParams["mathtext.rm"] = "Arial"
    plt.rcParams["mathtext.it"] = "Arial:italic"
    plt.rcParams["mathtext.bf"] = "Arial:bold"
Visualizing Precipitation vs Search Interest in Dengue Symptoms#
This plot compares monthly rainfall and Google search interest in “dengue symptoms”, using log-scaling to smooth trend fluctuations.
The goal is to visually inspect if increases in rainfall correspond with spikes in public concern.
import numpy as np
import matplotlib.pyplot as plt

setup_matplotlib()

fig, ax1 = plt.subplots(figsize=(12, 5))

# Plot tp on left y-axis
ax1.plot(df_dengue_merged['date'], df_dengue_merged['tp'], color='tab:blue', marker='o', label='Total Precipitation (tp)')
ax1.set_ylabel('Total Precipitation (mm)', color='tab:blue')
ax1.tick_params(axis='y', labelcolor='tab:blue')

# Apply log transform to dengue column
dengue_log = np.log(df_dengue_merged['dengue symptoms'] + 1)  # Add 1 to avoid log(0)

# Plot on right y-axis
ax2 = ax1.twinx()
ax2.plot(df_dengue_merged['date'], dengue_log, color='tab:orange', marker='s', label='searches for \'dengue symptoms\' (log-scaled)')
ax2.set_ylabel('Log of \'dengue symptoms\' Trend', color='tab:orange')
ax2.tick_params(axis='y', labelcolor='tab:orange')

# Title and grid
plt.title('Total Precipitation vs Google Trends for \'dengue symptoms\' (Log-Transformed)')
ax1.set_xlabel('Date')
ax1.grid(True)
fig.tight_layout()

plt.show()
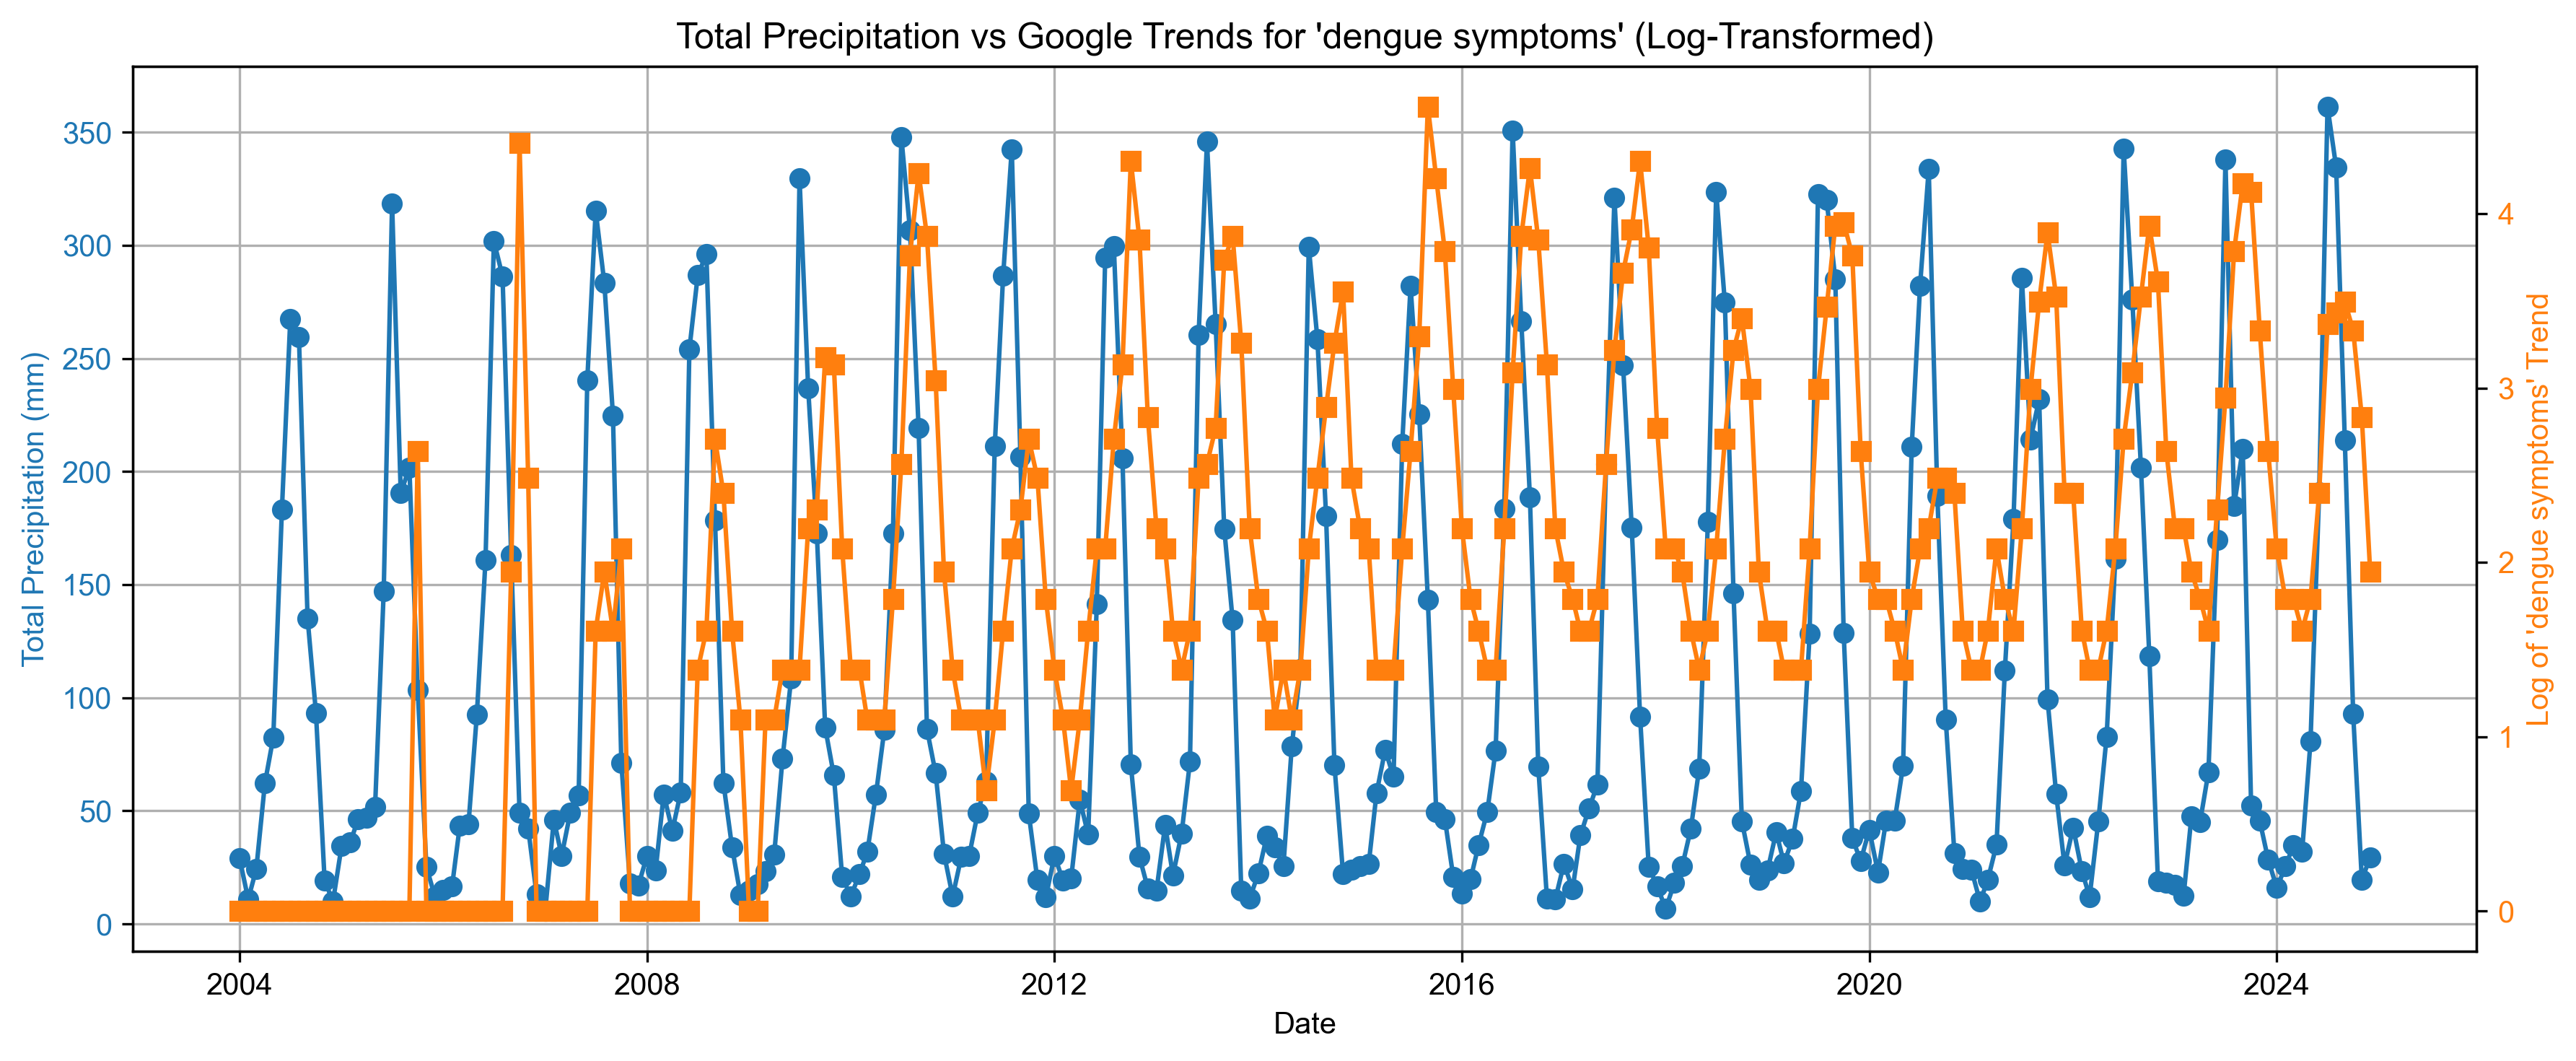
There appears to be a pattern where search interest in dengue symptoms rises after peak rainfall months, which aligns with known transmission cycles for mosquito-borne diseases.
Visualizing Precipitation vs Search Interest in Malaria Symptoms#
We repeat the same visualization approach for malaria symptoms to examine whether precipitation patterns precede or coincide with rising public awareness of malaria risk.
import numpy as np
import matplotlib.pyplot as plt

setup_matplotlib()

fig, ax1 = plt.subplots(figsize=(12, 5))

# Plot tp on left y-axis
ax1.plot(df_malaria_merged['date'], df_malaria_merged['tp'], color='tab:blue', marker='o', label='Total Precipitation (tp)')
ax1.set_ylabel('Total Precipitation (mm)', color='tab:blue')
ax1.tick_params(axis='y', labelcolor='tab:blue')

# Apply log transform to malaria column
malaria_log = np.log(df_malaria_merged['malaria symptoms'] + 1)  # Add 1 to avoid log(0)

# Plot on right y-axis
ax2 = ax1.twinx()
ax2.plot(df_malaria_merged['date'], malaria_log, color='tab:orange', marker='s', label='searches for \'malaria symptoms\' (log-scaled)')
ax2.set_ylabel('Log of \'malaria symptoms\' Trend', color='tab:orange')
ax2.tick_params(axis='y', labelcolor='tab:orange')

# Title and grid
plt.title('Total Precipitation vs Google Trends for \'malaria symptoms\' (Log-Transformed)')
ax1.set_xlabel('Date')
ax1.grid(True)
fig.tight_layout()

plt.show()
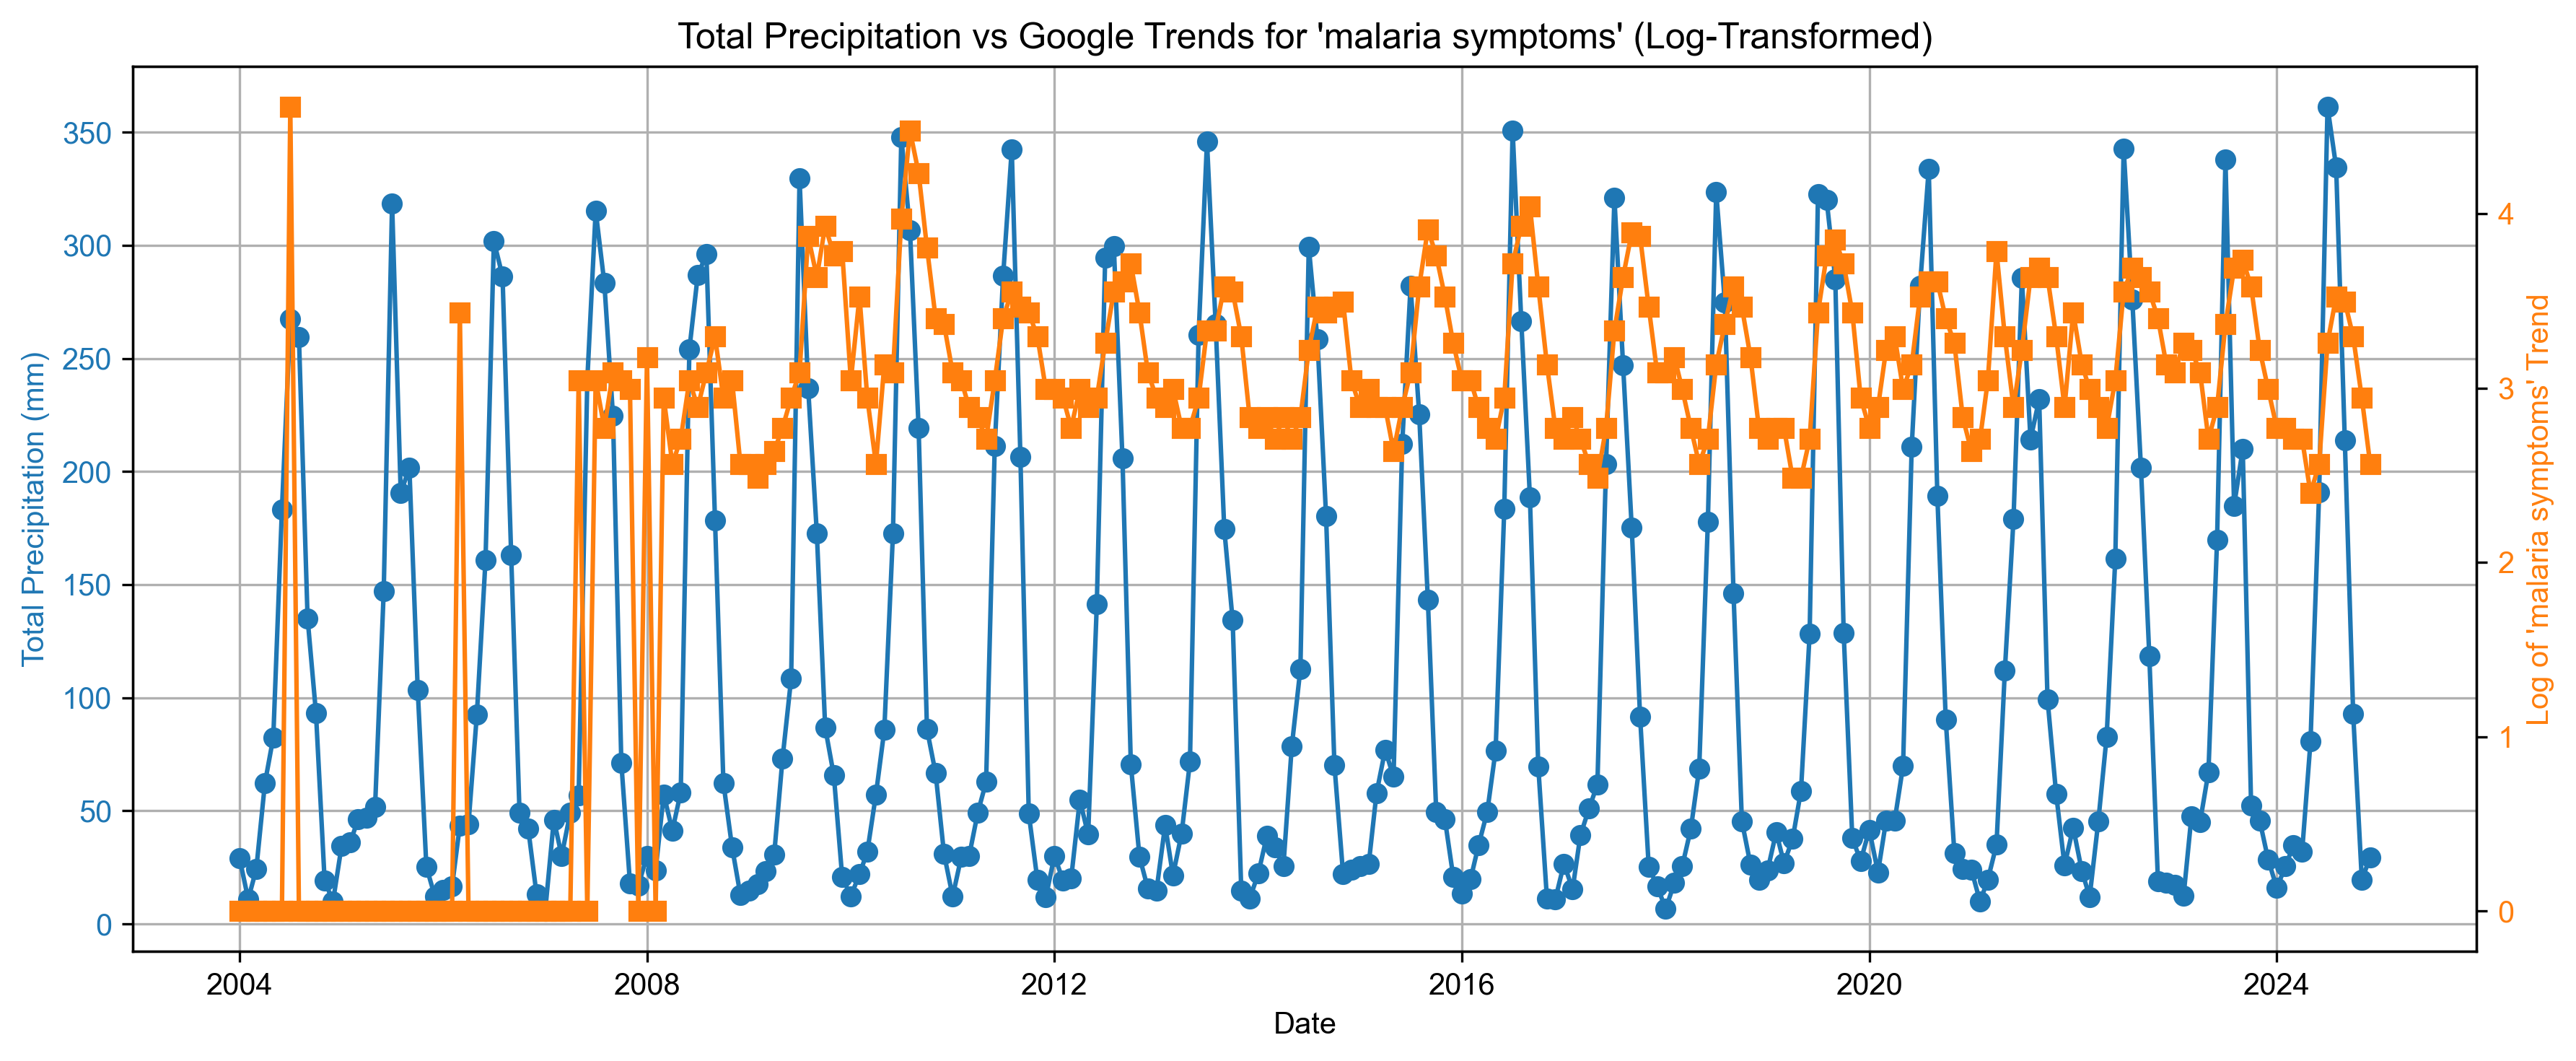
As with dengue, malaria-related search interest often increases shortly after heavy rainfall, suggesting a seasonal awareness cycle.
Cross-Correlation: Dengue Symptoms vs Precipitation#
We use cross-correlation to check if dengue interest lags or leads precipitation.
A positive lag means rainfall leads search interest.
This helps assess whether people become concerned after rainy periods.
import numpy as np

tp = (df_dengue_merged['tp'] - df_dengue_merged['tp'].mean()) / df_dengue_merged['tp'].std()
dengue = (df_dengue_merged['dengue symptoms'] - df_dengue_merged['dengue symptoms'].mean()) / df_dengue_merged['dengue symptoms'].std()

# Full cross-correlation
corr = np.correlate(dengue - dengue.mean(), tp - tp.mean(), mode='full')
lags = np.arange(-len(dengue)+1, len(dengue))
corr = corr / (len(dengue) * dengue.std() * tp.std())  # Normalize

lag_limit = 12
mask = (lags >= -lag_limit) & (lags <= lag_limit)
lags_limited = lags[mask]
corr_limited = corr[mask]

# Plot
plt.figure(figsize=(10, 5))
plt.stem(lags_limited, corr_limited)
plt.xlabel('Lag (months)')
plt.ylabel('Cross-correlation')
plt.title('CCF: Searches for \'dengue symptoms\' vs Total Precipitation')
plt.axvline(0, color='gray', linestyle='--')
plt.grid(True)
plt.tight_layout()
plt.show()
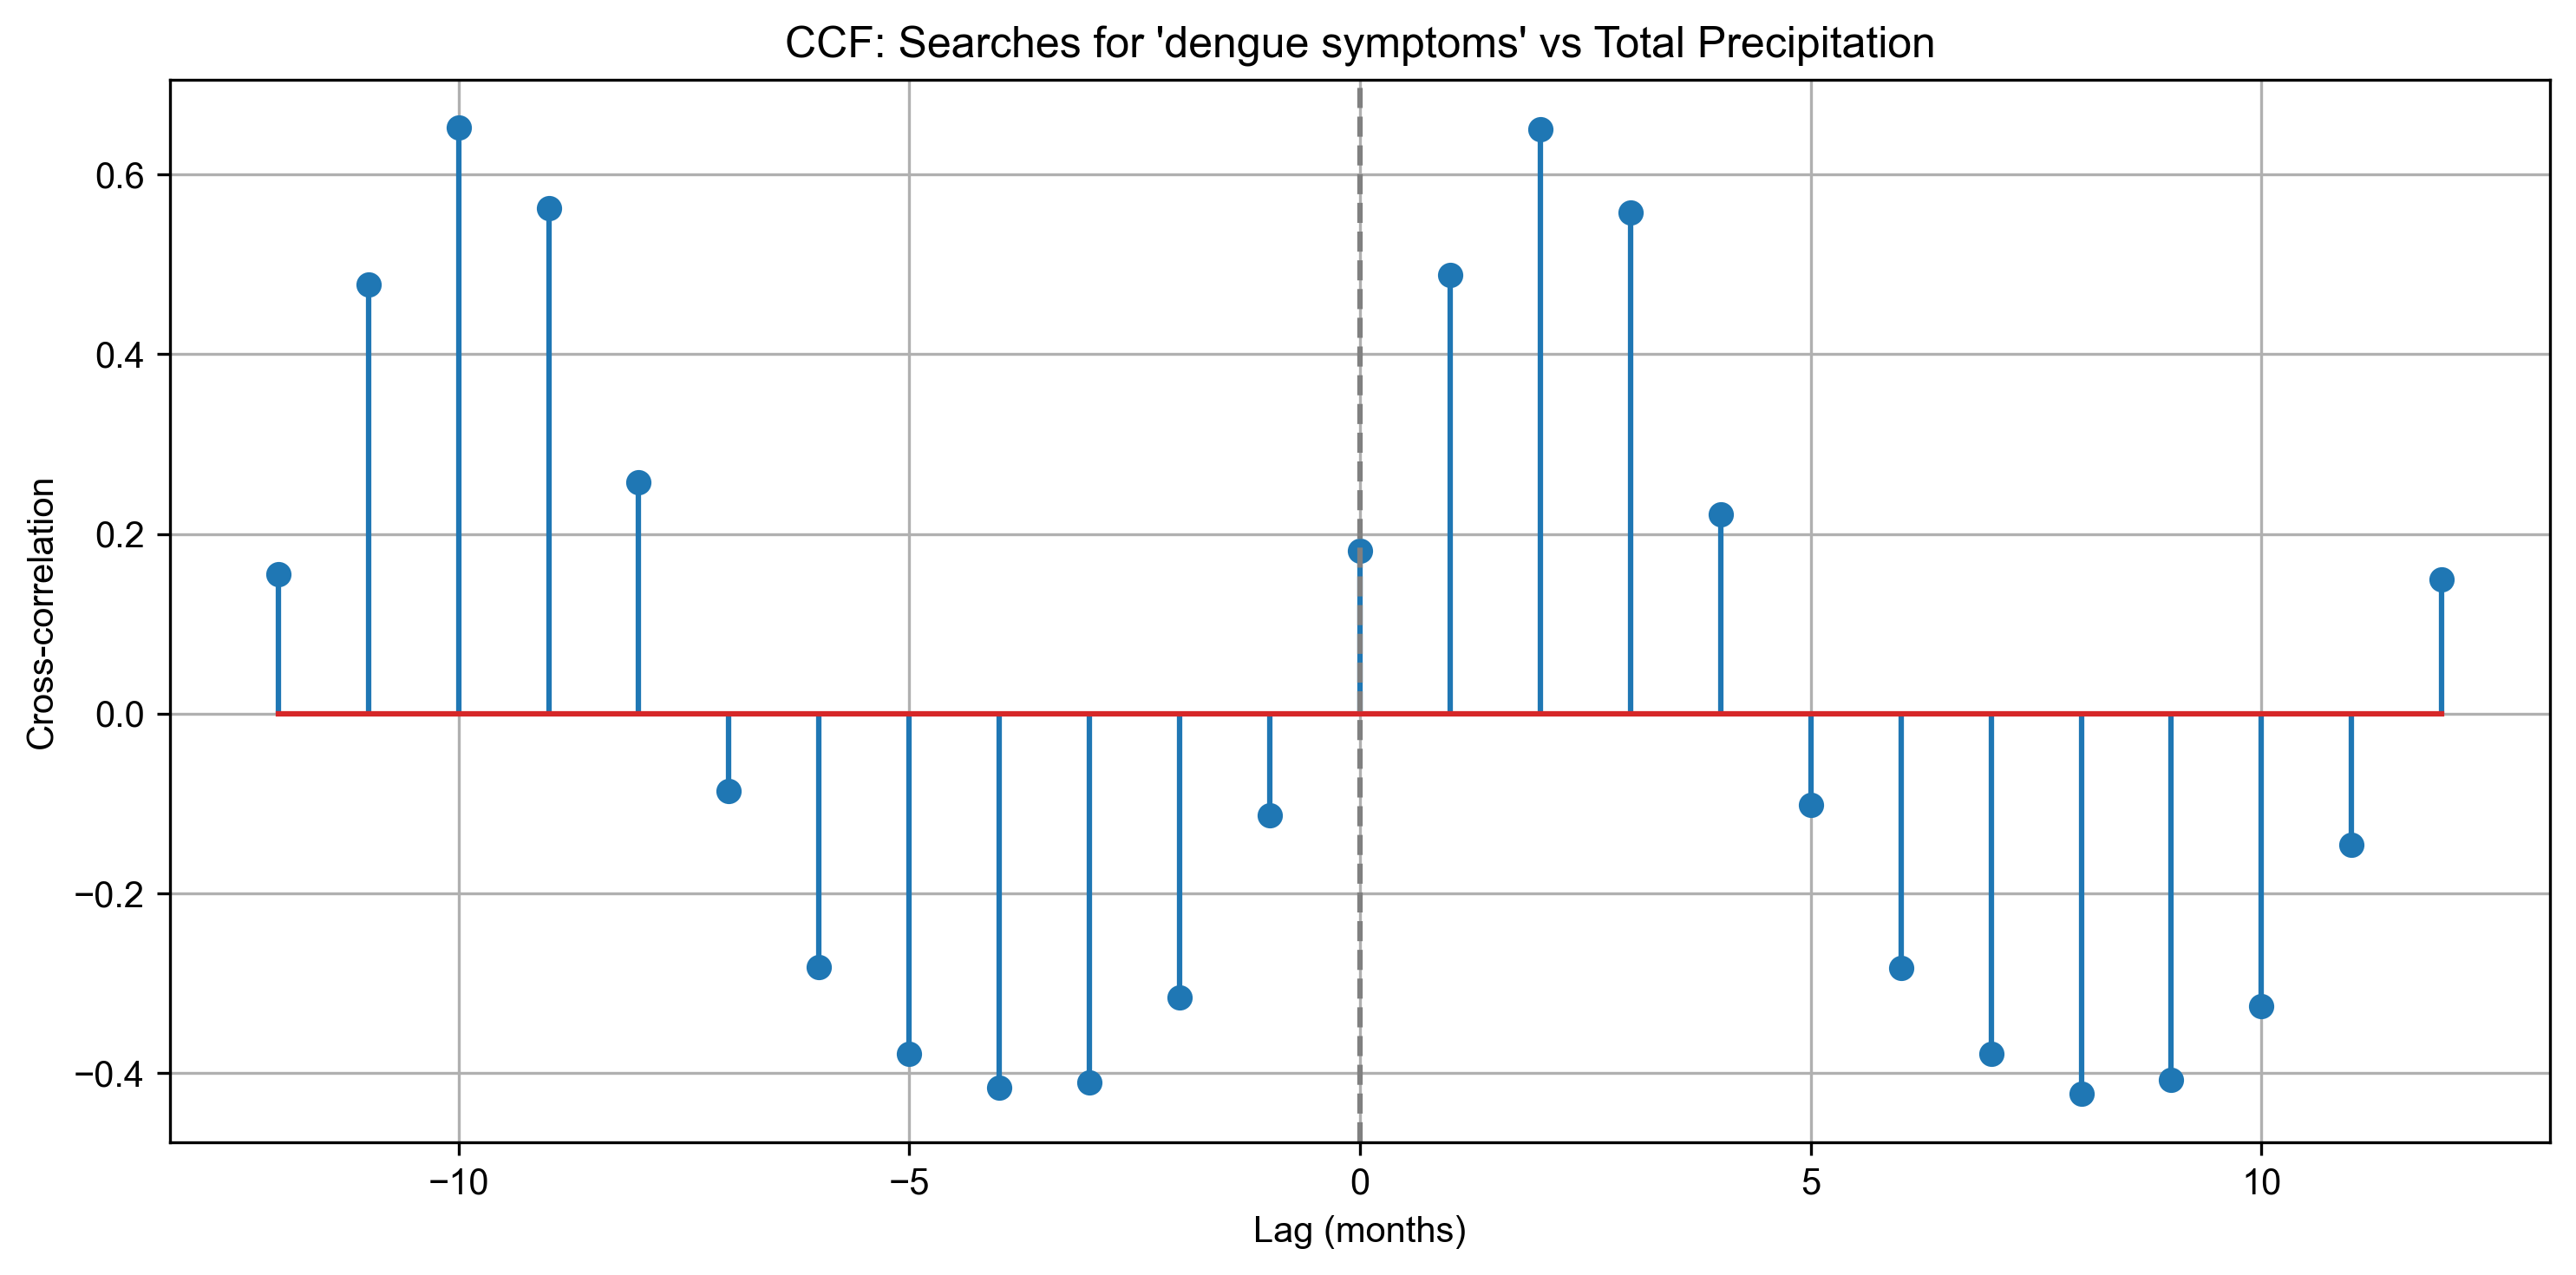
The CCF plot shows that search interest in dengue symptoms tends to follow rainfall by 2 months, indicating that public awareness spikes after breeding conditions increase.
Cross-Correlation: Malaria Symptoms vs Precipitation#
We repeat the same analysis for malaria, testing how far search trends lag or lead relative to precipitation.
import numpy as np

tp = (df_malaria_merged['tp'] - df_malaria_merged['tp'].mean()) / df_malaria_merged['tp'].std()
malaria = (df_malaria_merged['malaria symptoms'] - df_malaria_merged['malaria symptoms'].mean()) / df_malaria_merged['malaria symptoms'].std()

# Full cross-correlation
corr = np.correlate(malaria - malaria.mean(), tp - tp.mean(), mode='full')
lags = np.arange(-len(malaria)+1, len(malaria))
corr = corr / (len(malaria) * malaria.std() * tp.std())  # Normalize

lag_limit = 12
mask = (lags >= -lag_limit) & (lags <= lag_limit)
lags_limited = lags[mask]
corr_limited = corr[mask]

# Plot
plt.figure(figsize=(10, 5))
plt.stem(lags_limited, corr_limited)
plt.xlabel('Lag (months)')
plt.ylabel('Cross-correlation')
plt.title('CCF: Searches for \'malaria symptoms\' vs Total Precipitation')
plt.axvline(0, color='gray', linestyle='--')
plt.grid(True)
plt.tight_layout()
plt.show()
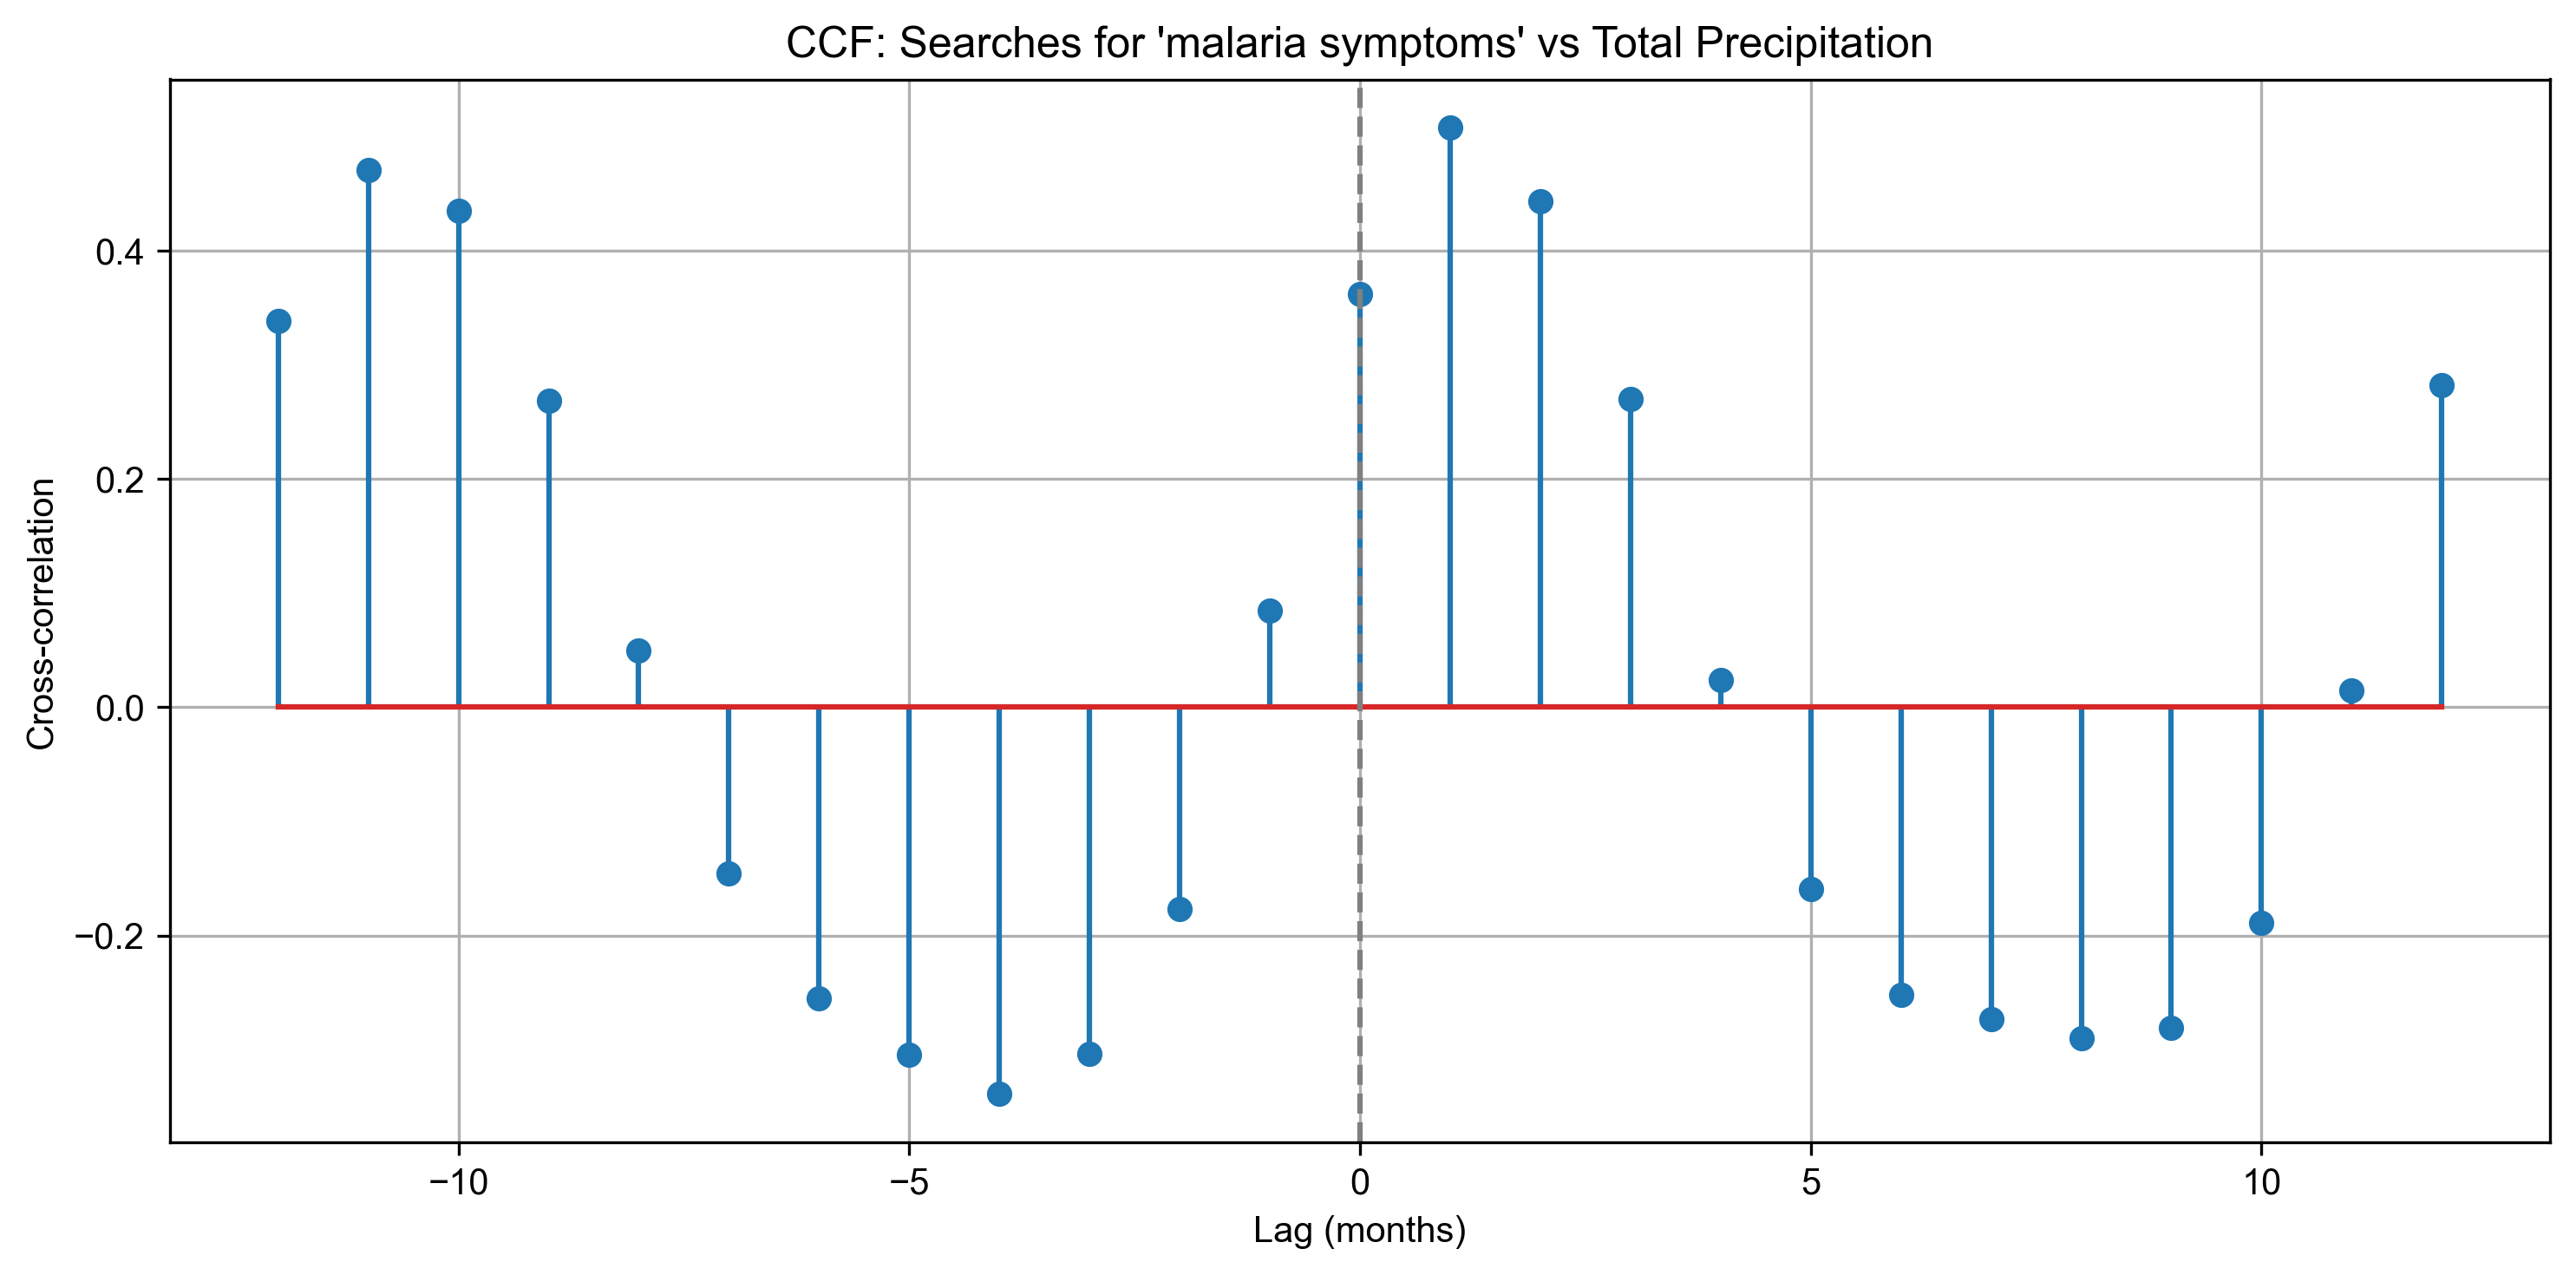
Similar to dengue, malaria search trends lag behind rainfall, (1 month to be exact), suggesting that increased rainfall is followed by heightened public awareness.
Conclusion#
This analysis demonstrates that total precipitation in India is positively correlated with public search interest in mosquito-borne diseases like dengue and malaria.
Peak rainfall often precedes rising public concern by 1–2 months
Cross-correlation confirms a lagging relationship, which aligns with seasonal mosquito activity and disease outbreaks
By combining climate data extracted using varunayan with search behavior, we can understand the environmentally driven public health patterns.