Live AQI Monitoring
from vayuayan import CPCBLive
import json
import time
from datetime import datetime
import pandas as pd
1. Get Your Location
# Initialize the Live AQI client
client = CPCBLive()

# Get your location
location = client.get_system_location()
print("Your Location:")
print(json.dumps(location, indent=2))
Your Location:
[
  19.0748,
  72.8856
]
2. Find Nearest Monitoring Station
# Find nearest station
nearest_station = client.get_nearest_station()
print("Nearest Monitoring Station:")

# Extract station ID for future use
station_id = nearest_station[0]
station_name = nearest_station[1]
print(f"\nMonitoring Station ID: {station_id}")
print(f"Station Name: {station_name}")
Nearest Monitoring Station:

Monitoring Station ID: site_5104
Station Name: Kurla, Mumbai - MPCB
3. Get Current Air Quality Data
# Get current AQI data
aqi_data = client.get_live_aqi_data(station_id=station_id)

if isinstance(aqi_data, Exception):
    print(f"❌ {aqi_data}")
print(f"Current Air Quality at {station_name}:")
metrics = aqi_data.get("metrics", [])
if metrics:
    print("Pollutant   Avg   Min   Max   Period")
    print("-" * 40)
    for m in metrics:
        print(
            f"{m['name']:<10} {m['avg']:<5} {m['min']:<5} {m['max']:<5} {m['avgDesc']}"
        )
else:
    print("No data available, possibly due to station being offline.")
Current Air Quality at Kurla, Mumbai - MPCB:
Pollutant   Avg   Min   Max   Period
----------------------------------------
PM2.5      62    51    83    Over the last 24 hours
PM10       77    60    106   Over the last 24 hours
NO2        5     4     7     Over the last 24 hours
NH3        1     1     2     Over the last 24 hours
SO2        37    36    37    Over the last 24 hours
CO         9     4     16    Over the last 8 hours
OZONE      28    22    29    Over the last 8 hours
4. Continuous Monitoring
import matplotlib.pyplot as plt

# Analyze and plot time series for each pollutant in last_hours
# Collect all pollutants' time series
pollutant_names = []
all_values = []
all_dates = None

for pollutant in aqi_data["last_hours"]:
    name = pollutant["name"]
    data = pollutant["data"]
    if not data:
        continue

    dates = [entry["date"] for entry in data]
    values = [entry["val"] for entry in data]

    # Convert dates to datetime
    dates_dt = pd.to_datetime(dates)
    pollutant_names.append(name)
    all_values.append(values)
    if all_dates is None:
        all_dates = dates_dt

# Format x-axis labels as "HourAM/PM, DD/MM/YY"
x_labels = [
    dt.strftime("%I%p, %d/%m/%y").replace("AM", "AM").replace("PM", "PM")
    for dt in all_dates
]

plt.figure(figsize=(14, 6))
for i, values in enumerate(all_values):
    plt.plot(all_dates, values, marker="o", label=pollutant_names[i])

plt.title(f"Pollutant Levels - Last {len(all_dates)} Hours")
plt.xlabel("Time")
plt.ylabel("Value")
plt.xticks(all_dates, x_labels, rotation=45)
plt.grid(True, alpha=0.3)
plt.tight_layout()
plt.legend()
plt.show()

# Show min, max, mean for each pollutant
for i, values in enumerate(all_values):
    print(f"\n{pollutant_names[i]} Analysis:")
    print(f"  Min: {min(values)}")
    print(f"  Max: {max(values)}")
    print(f"  Mean: {sum(values)/len(values):.2f}")
C:\Users\mahes\AppData\Local\Temp\ipykernel_22044\2686430132.py:19: UserWarning: Could not infer format, so each element will be parsed individually, falling back to `dateutil`. To ensure parsing is consistent and as-expected, please specify a format.
  dates_dt = pd.to_datetime(dates)
C:\Users\mahes\AppData\Local\Temp\ipykernel_22044\2686430132.py:19: UserWarning: Could not infer format, so each element will be parsed individually, falling back to `dateutil`. To ensure parsing is consistent and as-expected, please specify a format.
  dates_dt = pd.to_datetime(dates)
C:\Users\mahes\AppData\Local\Temp\ipykernel_22044\2686430132.py:19: UserWarning: Could not infer format, so each element will be parsed individually, falling back to `dateutil`. To ensure parsing is consistent and as-expected, please specify a format.
  dates_dt = pd.to_datetime(dates)
C:\Users\mahes\AppData\Local\Temp\ipykernel_22044\2686430132.py:19: UserWarning: Could not infer format, so each element will be parsed individually, falling back to `dateutil`. To ensure parsing is consistent and as-expected, please specify a format.
  dates_dt = pd.to_datetime(dates)
C:\Users\mahes\AppData\Local\Temp\ipykernel_22044\2686430132.py:19: UserWarning: Could not infer format, so each element will be parsed individually, falling back to `dateutil`. To ensure parsing is consistent and as-expected, please specify a format.
  dates_dt = pd.to_datetime(dates)
C:\Users\mahes\AppData\Local\Temp\ipykernel_22044\2686430132.py:19: UserWarning: Could not infer format, so each element will be parsed individually, falling back to `dateutil`. To ensure parsing is consistent and as-expected, please specify a format.
  dates_dt = pd.to_datetime(dates)
C:\Users\mahes\AppData\Local\Temp\ipykernel_22044\2686430132.py:19: UserWarning: Could not infer format, so each element will be parsed individually, falling back to `dateutil`. To ensure parsing is consistent and as-expected, please specify a format.
  dates_dt = pd.to_datetime(dates)
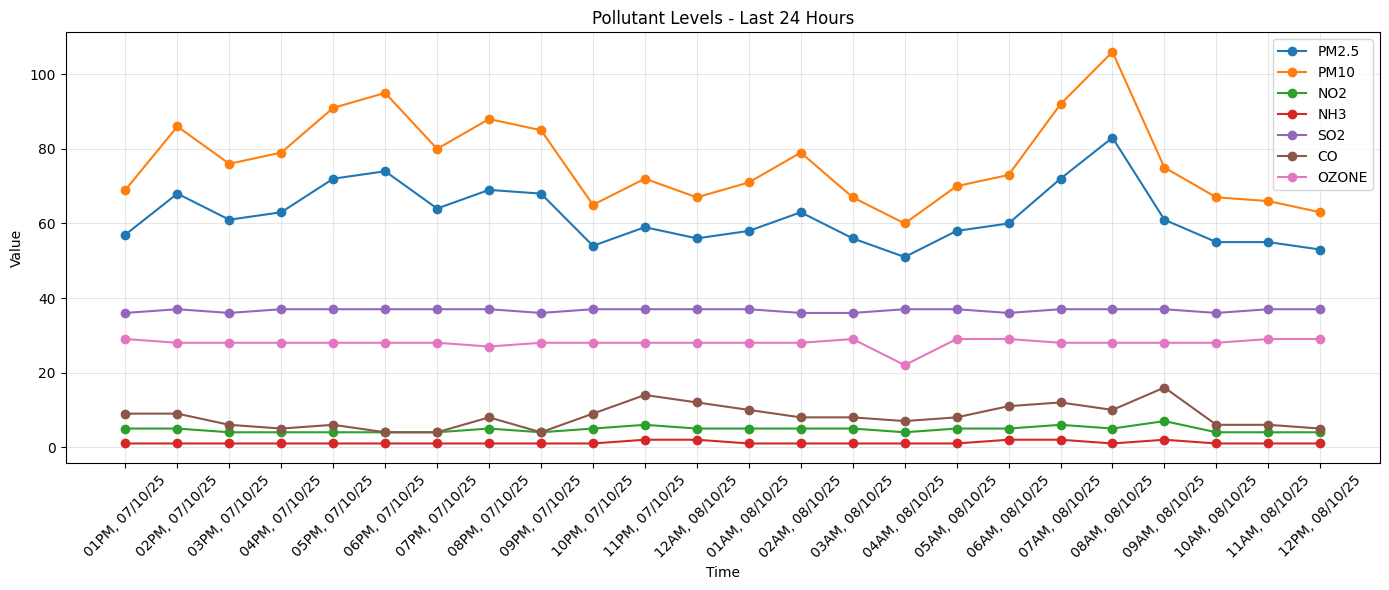
PM2.5 Analysis:
  Min: 51
  Max: 83
  Mean: 62.08

PM10 Analysis:
  Min: 60
  Max: 106
  Mean: 76.75

NO2 Analysis:
  Min: 4
  Max: 7
  Mean: 4.75

NH3 Analysis:
  Min: 1
  Max: 2
  Mean: 1.21

SO2 Analysis:
  Min: 36
  Max: 37
  Mean: 36.71

CO Analysis:
  Min: 4
  Max: 16
  Mean: 8.21

OZONE Analysis:
  Min: 22
  Max: 29
  Mean: 27.96
5. Set Up Alerts
def check_air_quality_alert(aqi_value):
    """
    Check AQI and return alert level.

    AQI Categories:
    - 0-50: Good
    - 51-100: Satisfactory
    - 101-200: Moderate
    - 201-300: Poor
    - 301-400: Very Poor
    - 401+: Severe
    """
    if aqi_value <= 50:
        return "✅ Good", "Air quality is good. Enjoy outdoor activities!"
    elif aqi_value <= 100:
        return "🟢 Satisfactory", "Air quality is acceptable."
    elif aqi_value <= 200:
        return (
            "🟡 Moderate",
            "Sensitive individuals should limit prolonged outdoor exposure.",
        )
    elif aqi_value <= 300:
        return (
            "🟠 Poor",
            "Everyone may begin to experience health effects. Reduce outdoor activities.",
        )
    elif aqi_value <= 400:
        return "🔴 Very Poor", "Health alert! Everyone should avoid outdoor activities."
    else:
        return (
            "🆘 Severe",
            "Health emergency! Stay indoors and avoid any outdoor exposure.",
        )


# Check current AQI
if aqi_data and "aqi" in aqi_data:
    print(aqi_data["aqi"])
    current_aqi = aqi_data["aqi"]
    alert_level, message = check_air_quality_alert(current_aqi["value"])

    print(f"\nCurrent AQI: {current_aqi}")
    print(f"Alert Level: {alert_level}")
    print(f"Recommendation: {message}")
{'param': 'PM10', 'value': 77, 'remark': 'Satisfactory', 'color': '#009933'}

Current AQI: {'param': 'PM10', 'value': 77, 'remark': 'Satisfactory', 'color': '#009933'}
Alert Level: 🟢 Satisfactory
Recommendation: Air quality is acceptable.
6. Get AQI for Specific Coordinates
# Example: Get AQI for Mumbai coordinates
mumbai_lat = 19.0760
mumbai_lon = 72.8777

coords = (mumbai_lat, mumbai_lon)

# Find nearest station to these coordinates
mumbai_station = client.get_nearest_station(coords=coords)
print("Nearest station to Mumbai:")
print(json.dumps(mumbai_station, indent=2))

# Get AQI data for that location
mumbai_aqi = client.get_live_aqi_data(coords=coords)
mumbai_aqi.pop("last_hours", None)  # Remove last_hours for brevity
print("\nCurrent AQI in Mumbai:")
print(json.dumps(mumbai_aqi, indent=2))
Nearest station to Mumbai:
[
  "site_5104",
  "Kurla, Mumbai - MPCB"
]

Current AQI in Mumbai:
{
  "title": "Kurla, Mumbai - MPCB",
  "nOfCom": 100,
  "down": "false",
  "downmessage": "",
  "date": "Wednesday, 08 Oct 2025 12:00 PM",
  "temp": "",
  "aqi": {
    "param": "PM10",
    "value": 77,
    "remark": "Satisfactory",
    "color": "#009933"
  },
  "metrics": [
    {
      "name": "PM2.5",
      "avg": 62,
      "avgDesc": "Over the last 24 hours",
      "min": 51,
      "max": 83,
      "pollutantName": "PM2.5"
    },
    {
      "name": "PM10",
      "avg": 77,
      "avgDesc": "Over the last 24 hours",
      "min": 60,
      "max": 106,
      "pollutantName": "PM10"
    },
    {
      "name": "NO2",
      "avg": 5,
      "avgDesc": "Over the last 24 hours",
      "min": 4,
      "max": 7,
      "pollutantName": "NO2"
    },
    {
      "name": "NH3",
      "avg": 1,
      "avgDesc": "Over the last 24 hours",
      "min": 1,
      "max": 2,
      "pollutantName": "NH3"
    },
    {
      "name": "SO2",
      "avg": 37,
      "avgDesc": "Over the last 24 hours",
      "min": 36,
      "max": 37,
      "pollutantName": "SO2"
    },
    {
      "name": "CO",
      "avg": 9,
      "avgDesc": "Over the last 8 hours",
      "min": 4,
      "max": 16,
      "pollutantName": "CO"
    },
    {
      "name": "OZONE",
      "avg": 28,
      "avgDesc": "Over the last 8 hours",
      "min": 22,
      "max": 29,
      "pollutantName": "OZONE"
    }
  ]
}