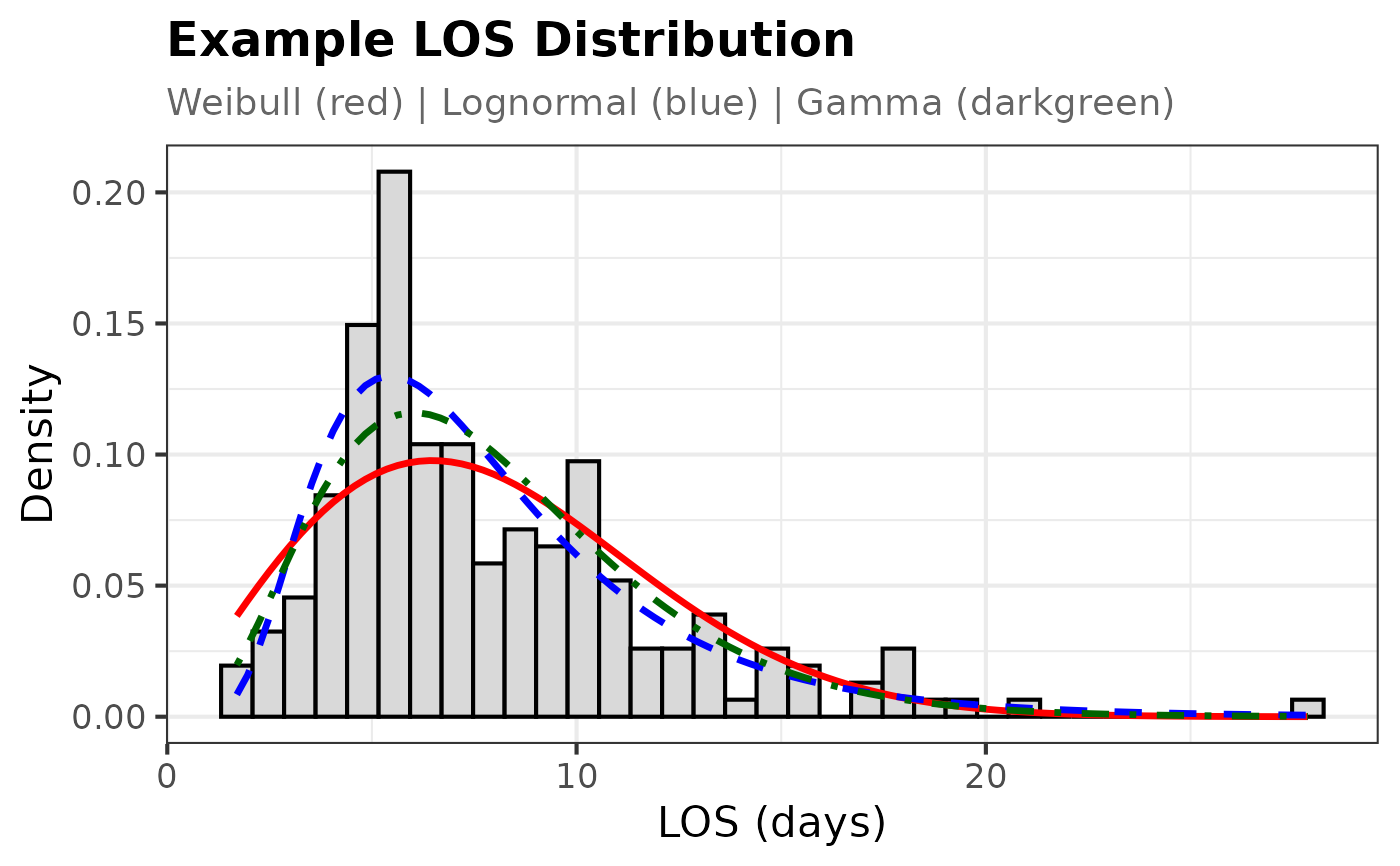
Creates a histogram of LOS values with Weibull, Lognormal, and Gamma density curves overlaid.
Arguments
- los_vec
Numeric vector of LOS values (days).
- title
Character. Plot title.
- bins
Integer. Number of histogram bins. Default 35.
- fits
Optional. Pre-computed fits from
fit_distributions().
Examples
plot_los_distributions(rlnorm(200, 2, 0.5), "Example LOS Distribution")